29 Jan Discover How Sand is The Permian’s Ticking Time Bomb
Rising crude oil and natural gas prices have been rising for the last two years, encouraging higher frac volume and increased activity in the Permian Basin, despite the expenses of frac sand transportation. But could frac sand be the ticking time bomb of the Permian Basin? Learn more in the free frac sand infographic below:
Free Frac Sand Infographic
Click to view the full-size graphic.
Dragon Products LTD can help you save big on frac sand delivery systems. Learn more about Dragon Sand Force.
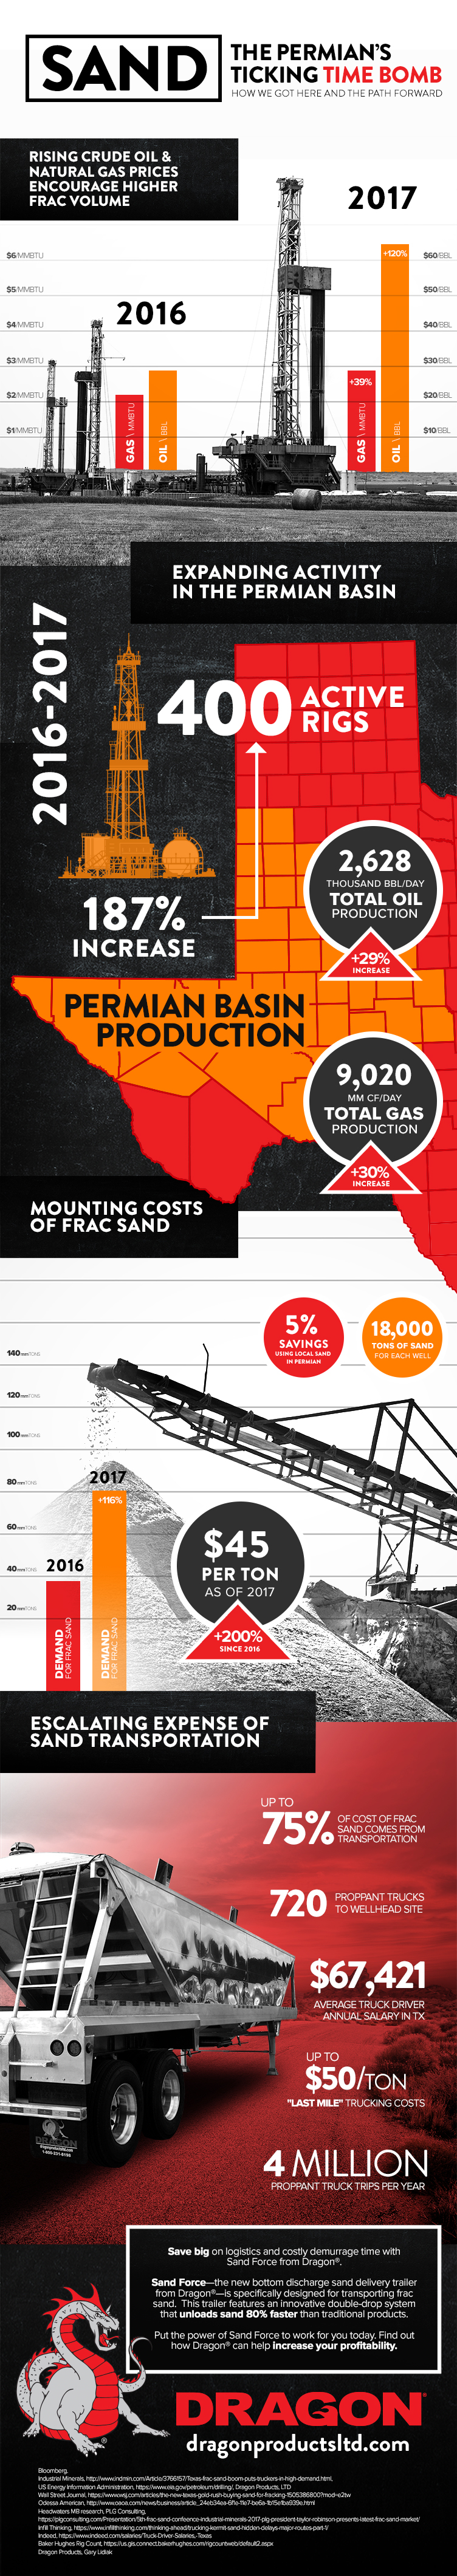
How we got here and the path forward
Rising Crude Oil & Natural Gas Prices Encourage Higher Frac Volume
From 2016 to 2017, Natural Gas prices rose 39% from $2.100/MMBTU to $2.925/MMBTU. In the same time period, crude oil prices rose from $28.94/bbl to $63.86/bbl—a 120% increase.
Expanding Activity in the Permian Basin
From 2016 to present, the number of active rigs increased 187% to 400 active rigs.
The current total oil production in 2017 is 2,628 thousand barrels per day, a 29% increase over the previous year.
The total gas production increased 30% to 9,020 MM CF/day.
Mounting Costs of Frac Sand
Well operators can see 5% savings when using local sand from the Permian, and each well uses approximately 18,000 tons of sand or other proppant.
The price of frac sand has risen 3 times since 2016, up to more than $45 per ton.
Likewise, the demand has surged from 37 million tons in 2016 to more than 80 million tons—a more than 2.2 times increase.
Escalating Expense of Frac Sand Transportation
Up to 75% of cost of frac sand comes from transportation, with “last mile” trucking costs reaching up to $50 per ton.
The average Texas truck driver salary tops $67,000 per year.
Each wellhead site receives about 720 proppant trucks. This is 4 million proppant truck trips per year!
Contact us for more information
[contact-form-7 id=”3624″ title=”Tanks/Trailers -Lead Form”]
Sorry, the comment form is closed at this time.